A tool for quantifiably improving user experience in your applications by identifying repetitive tasks.
![]()
download
Available for mac or windows. Both files include an application along with the C++ source code, written for the Qt framework. Note that I'm not 100% certain the apps will work, Qt seems to have some rough edges when it comes to deploying at least Windows-based apps. As far as I can tell everything should be fine, but if there are any problems, my apologies. Also, usual disclaimers: I am not responsible for any damage caused as a result of using this software or code.
intro
I recently hit a case in an application I develop where, after years of use, I suddenly realized there was a very obvious workflow improvement to be made. The problem should have been identified long ago: Anyone using the app will generally perform a specific sequence of tasks before using a certain feature. The sequence is so obvious, I began wondering why I'm not using a tool to identify cycles and patterns in workflow, as an automatic check for catching such inefficiencies.
UI Trace is a tool that displays a graph of user interactions and identifies cycles in behaviour. There are three pieces: a visualization tool that displays log files of user behaviour generated by a log writer in your app.
ui trace, the visualization tool
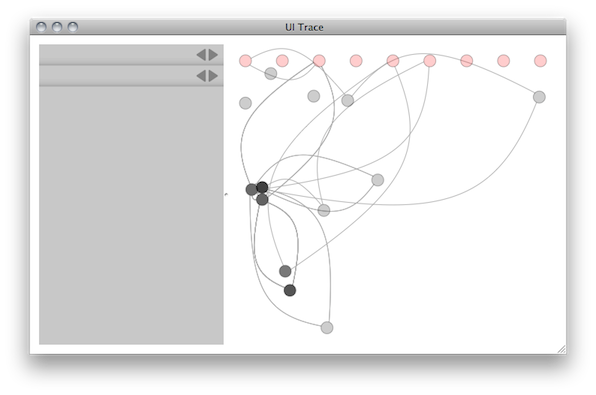
UI Trace displays user interactions with your application. It displays three types of events: mouse down, mouse up and menu invocations (although mouse up events aren't currently used for anything, and will merely roll into mouse downs). You can load log files by either dropping into the main window or through the File->Open menu.
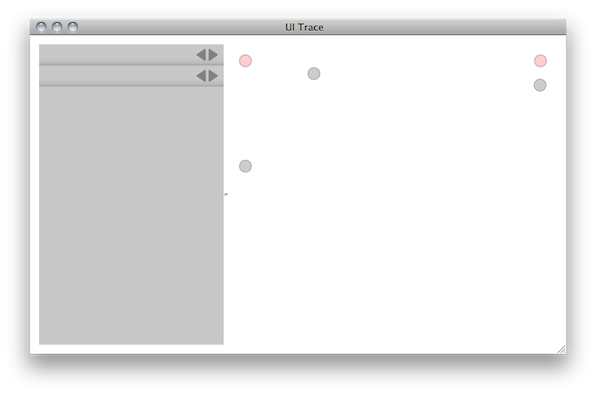
This window shows a very simple log: The user operated two separate menus, represented by the reddish nodes along the top (menus are always displayed in a row at the top, to signify their disruption from the normal workflow), as well as three separate widgets in the main app.
Right away, we get a sense of user behaviour: For example, in this case, the user has the most complex interactions in the lower left area of the screen. One wonders what exactly is occurring in the node at the far top right, and whether it might make sense to move that behaviour closer to the main interactions? Obviously optimizations of this nature are entirely application dependent, but that is an example of the kind of question this tool might prompt. Also, note that this tool provides a context for that top right node: As you examine the nodes involved in patterns, you will see the order each node is used, which might provide an indication on when and how behaviour can be more closely physically located.
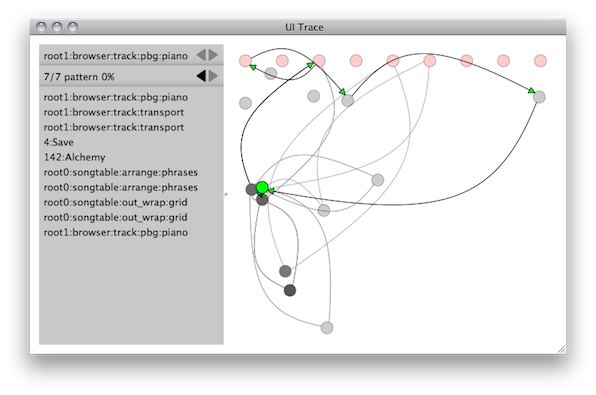
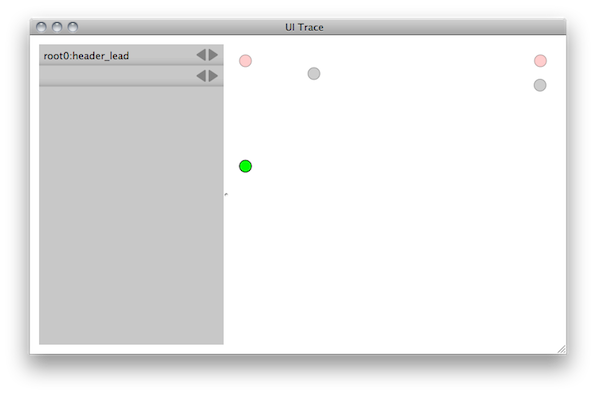
Selecting a head node will display the node name along with the nodes involved in the pattern. Like nodes, you can use the arrow buttons to step through however many patterns have been found for this node. Each pattern also has a rank, suggesting how disruptive it might be for users. The ranks run from 0%, for least disruptive, to 100%, for most. As mentioned, the notion of "disruptive" is currently very simple, just a count of how many times the pattern has occurred compared to the pattern with the most occurrences. In reality, this will be more likely to catch patterns that are simply common, not necessarily disruptive.
Nodes can also be selected by the Select->By Rank menu. This will select all nodes that have patterns, organized by the ones with the highest rank.
log file
The logs are simple .txt files that use a json syntax. Here's an example:
{
    "app": "temper", "session": 1298401862, "down": [
        2619000, "root0:header_lead", 348, 215
    ], "up": [
        2960000, "root0:header_lead", 348, 242
    ], "menu": [
        6975000, "80:Massive"
    ], "down": [
        9118000, "root0:songtable:in_wrap:in_pipelines", 523, 199
    ], "up": [
        9212000, "root0:songtable:in_wrap:in_pipelines", 523, 199
    ], "menu": [
        11498000, "94:PhotonX25"
    ], "down": [
        18551000, "root0:songtable:out_wrap:grid", 1101, 201
    ]
}
A log file is composed of one or more json object blocks. The object begins with an app name, and it currently has a session ID but this is unused and will likely be deprecated. Other than that, the object contains a series of arrays corresponding to down, up and menu gestures. Each array has two required pieces of information: First is an arbitrary time stamp, currently unused. Second is a unique name for the control the user has interacted with. Finally, down and up events also have the pixel location of the gesture, which ideally should be in the window coordinate system (for consistency in future versions, which might allow combining of multiple logs).
log writer
The logs are generated by your app. Included in the downloads is the code I use, written in C++. It runs a background thread that handles log requests from the client. Also included are a few support classes, such as a json writer I wrote. If you want to use my code, note there are a few pieces missing that should be supplied by whatever framework you're developing in, basic items like spawning threads and locking. Side note: The client logging code included in the download is freely available public domain code. You can use it in any way you like.
future
I think there are some interesting ways this software might develop. The most immediately useful would be to include a notion of which sessions generated given patterns, so a time slider can be included that lets you compare cycles from when you started logging to the current version of your app. This would give immediate feedback about exactly how improved your workflow has become over time.
It would be nice to provide log projects that allow merging of multiple log files, as well as identifying which users generated a particular file. It could be very interesting to compare the behaviour of multiple users against each other, as well as see how their patterns change over time.
A smaller change would be an option to allow users to turn off specific patterns in the visualization tool. Most patterns will be noise, tasks that are common and repetitious but can't be simplified. There should be a way to hide them permanently, so it's easier to identify actual problems.
Finally, there can always be improvements to cycle detection and pattern disruption ranking.
No comments:
Post a Comment